Key Features


Biodiversity Uptake Measurement
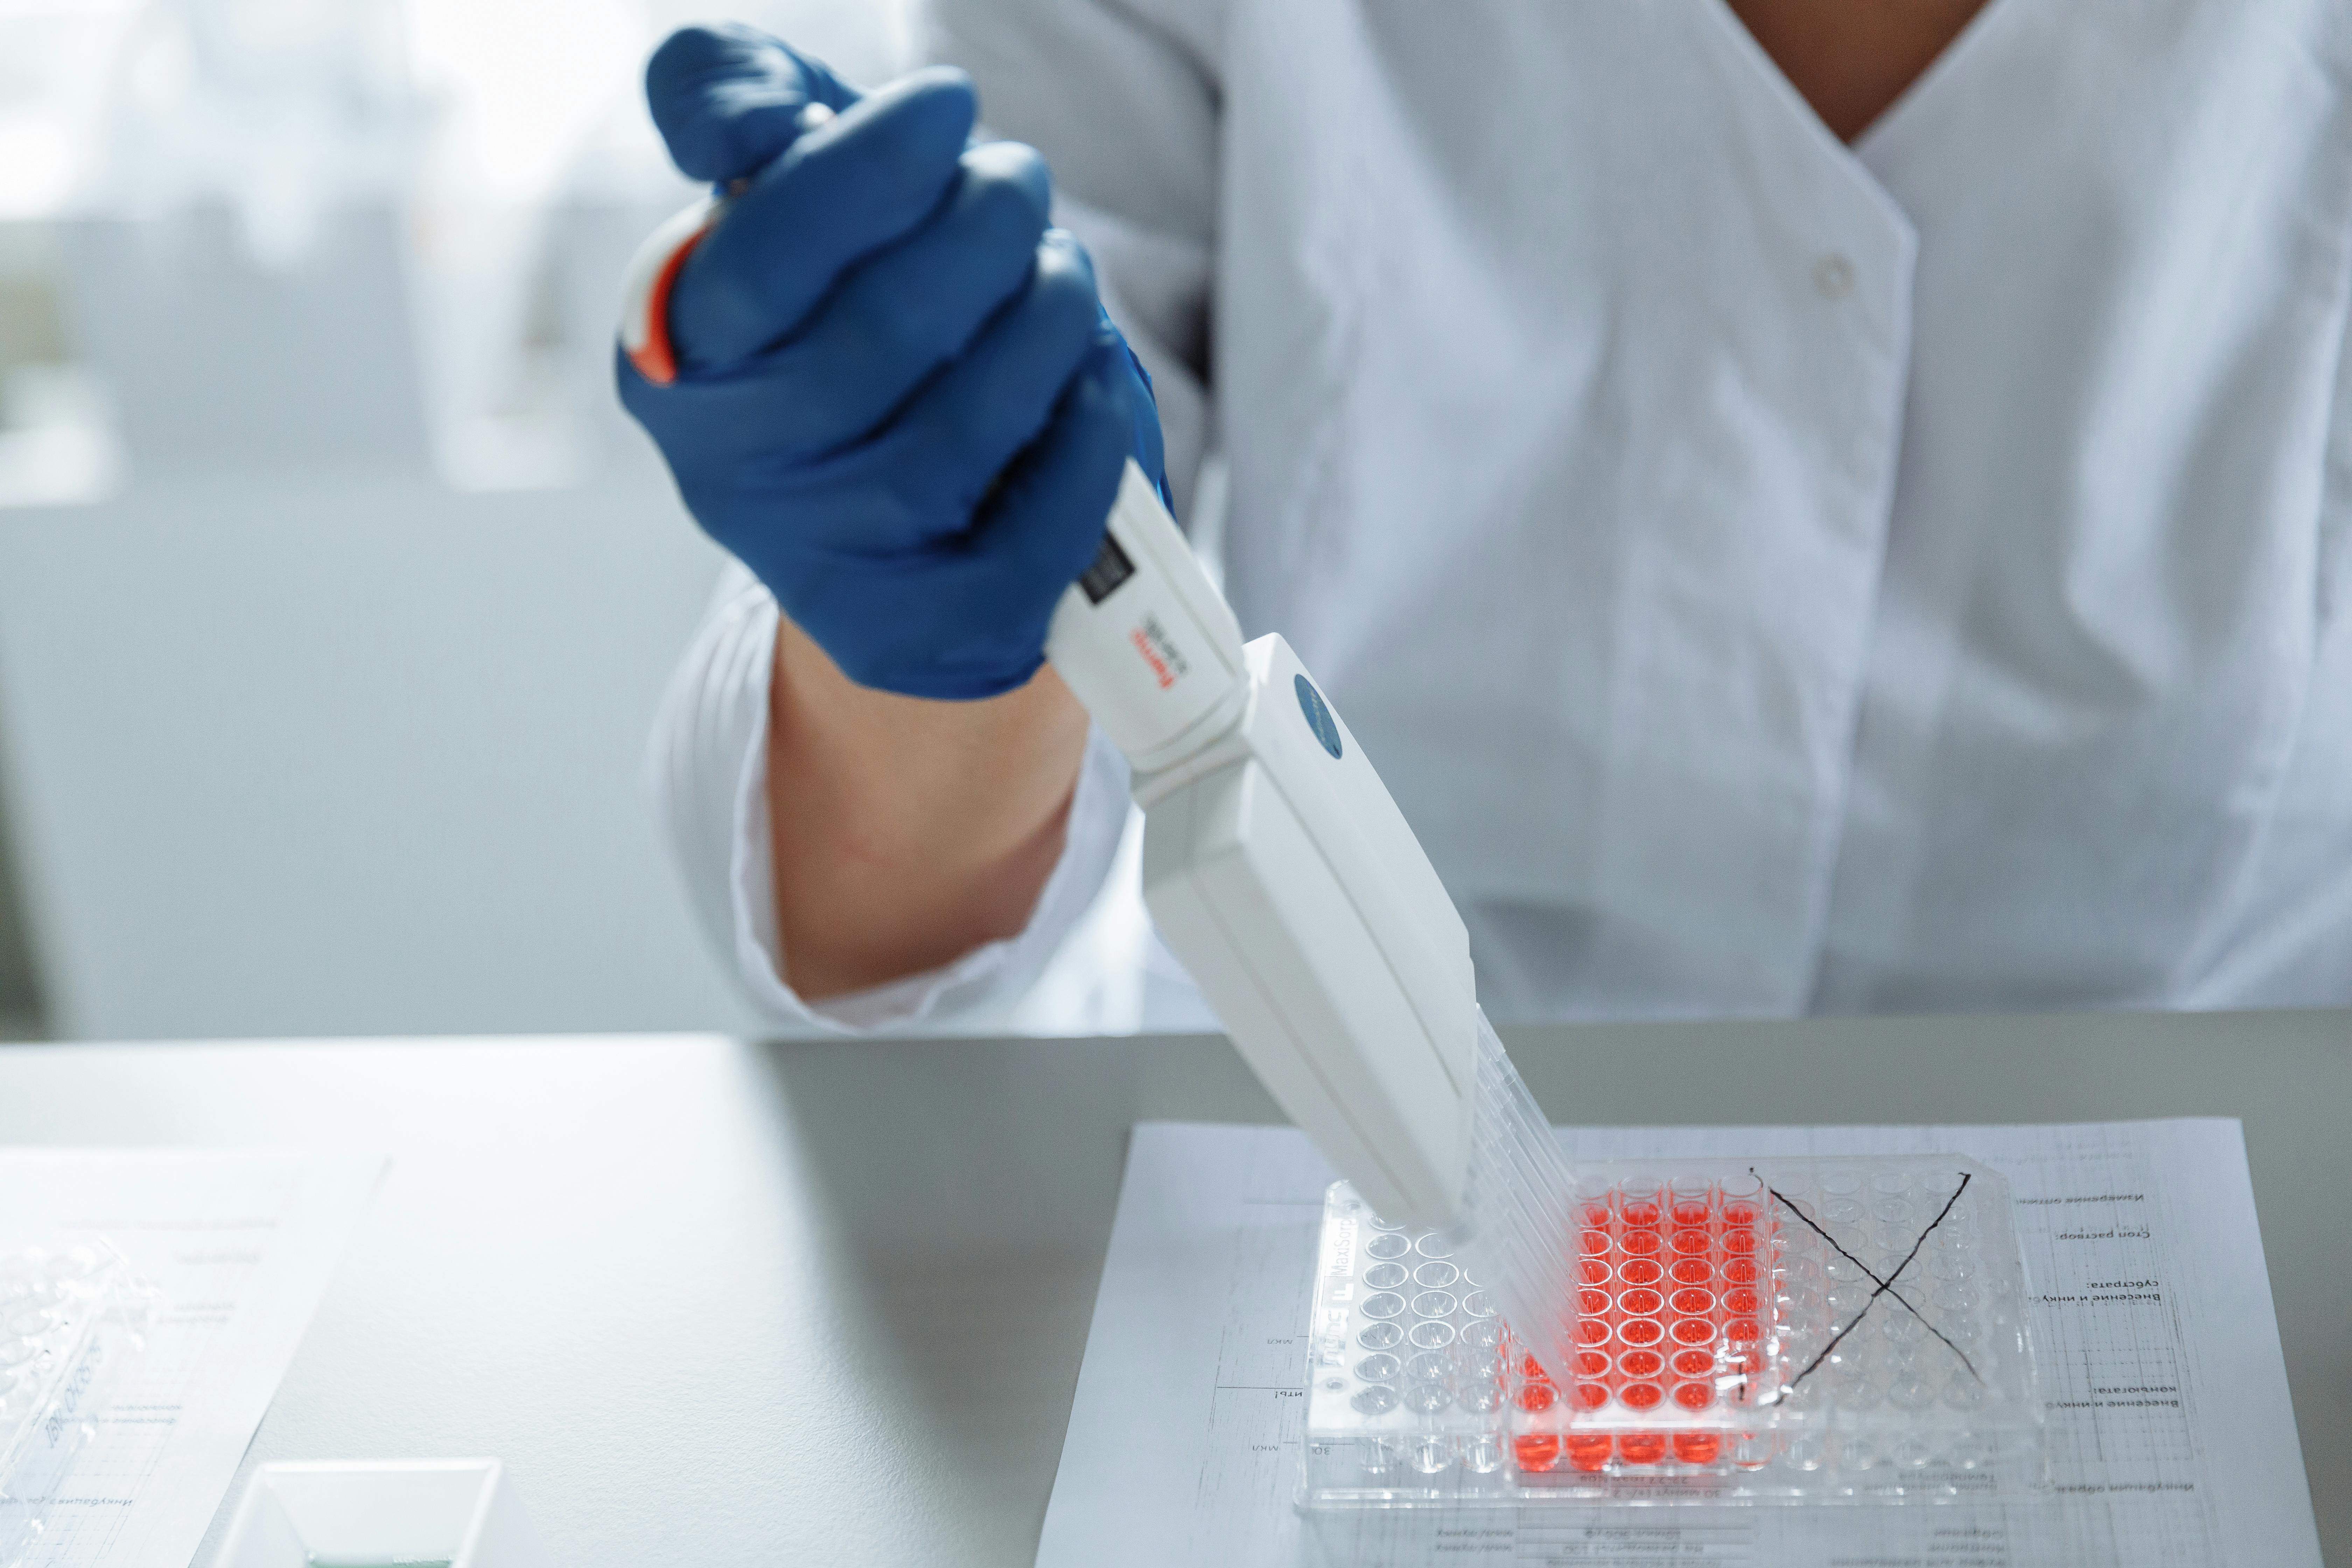
We collect soil samples from farms in your supply chain and analyze the biological health of the soil. This includes microbial diversity, soil organic carbon, and carbon use efficiency. These data points help track the impact of regenerative practices over time and support sustainability reporting under frameworks like CSRD, TNFD, and the EU Soil Monitoring Law.
Biodiversity Uptake Validator
Food companies are increasingly expected to report on biodiversity and soil health as part of sustainability obligations. However, reliable soil biodiversity data is hard to obtain. Existing chemical or satellite-based measurements often miss the biological layer that truly reflects ecosystem function.
We sample soil at selected farm sites and analyze the microbiome using environmental DNA sequencing. We combine this with carbon metrics such as carbon use efficiency to understand not just how much carbon is stored in the soil, but how well it is being processed. These results are benchmarked across fields and time, making it easy to track progress.
You receive validated, science-based insights into the biological and carbon dynamics of your soil. With MySoilDashboard, you can view these trends, compare across locations, and export charts, maps, and raw data directly into your reporting tools or sustainability documentation. This supports credible, data-driven claims around soil health and biodiversity improvements.
Soil bioremediation
We collect soil samples to understand what kind of pollution is in the soil. Based on this, we can recommend a biological product—or test one you already use. After application, we take new samples to see if the pollution has decreased and how the biology has changed. This gives you a full before-and-after view of the intervention.
Soil Bioremediator
Many companies do not fully understand how the soil microbiome helps with bioremediation. They don’t know what microbes are missing or what is needed to make the process work. As a result, biological treatments are often applied blindly, without clear results.
We start with a biological soil scan to see which microbial groups are present and how they function. We then match this data with known biological solutions, such as microbial blends or biostimulants. If you are already using a product, we can test its effect by comparing samples before and after treatment.
You get a clear remediation strategy or a validation of whether your product is working. We help you understand what is happening in the soil, how to improve it, and whether the intervention made a real impact.
Improving Crop Quality Through Soil Insight
We collect targeted soil samples using our in-field app and link them directly to crop quality metrics. By combining biological, chemical, and physical soil data with real crop output, we build a model that reveals which soil parameters affect product quality. This enables growers to take focused, evidence-based actions.
Crop Quality Improver
In many sectors, crop quality directly affects pricing and marketability. Yet growers often lack insight into why product quality varies between or within fields. Traditional soil metrics only go so far, and the biological dimension is often missing.
Using our MySoil sampling app, we collect targeted soil samples tied to specific crop batches. We then overlay microbial taxa, nematode presence, nutrient profiles, and texture data with measured crop quality indicators such as sugar content or starch levels. This allows us to identify what factors are helping or hurting crop quality, and turn that into direct field advice.
Growers receive clear, data-based recommendations to improve the quality of their crop. Coöperatives can use these insights to increase the consistency and market value of incoming product, reduce rejections, and strengthen advisory services with evidence-based guidance.
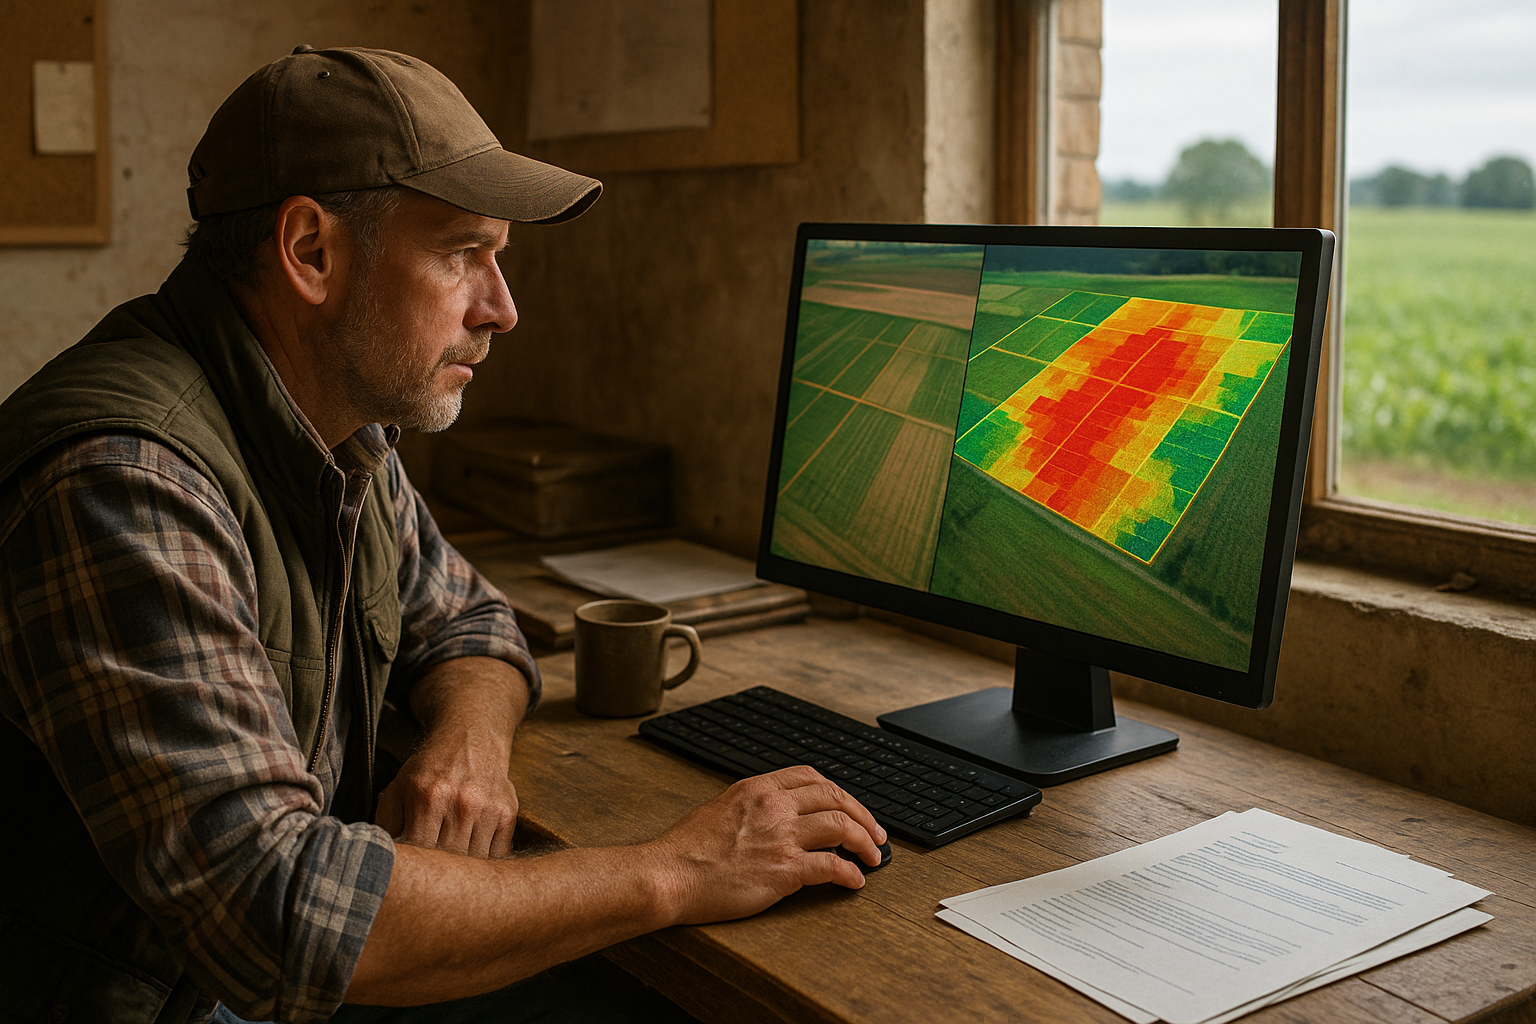
Yield Variance Diagnostics
We build a field-specific model that explains yield variation using high-resolution biological sampling. By combining actual yield data with our soil microbiome analysis, we identify the biological drivers behind underperformance and turn them into clear, actionable recommendations.
Yield Variance Explainer
In many fields, yields vary significantly from one area to another without a clear explanation. Physical and chemical soil data often fail to account for these differences. As a result, growers miss out on optimal yield and agronomists are left without the insights they need to respond.
We take yield maps from your field and design a targeted sampling strategy using our MySoil sampling app. Biological data from both high and low-yield zones are collected and combined with satellite and soil data. This allows us to pinpoint microbial or nematode taxa that are influencing yield outcomes. These insights are translated into specific management recommendations.
You gain a clear understanding of why yield varies across your field and which biological factors are responsible. This leads to more informed decisions, better input efficiency, and improved yield stability season after season.
Service Lab Support
With our fully in-house lab, certified under INSTAND and registered as an official German quarantine station, Soilytix offers fast, transparent, and science-grade soil analysis to academic R&D teams.
Many academic labs lack access to high-throughput sequencing and other specialized machines, forcing them to rely on third-party labs that are often slow, opaque, or non-collaborative.
At Soilytix, we run all sequencing, analysis, and reporting ourselves—with no outsourcing. Results are delivered within two weeks and made accessible via our MySoilDashboard platform. Each partner gets a dedicated contact person for any technical questions or raw data access needs. Transparency and speed come standard.
Your research stays on schedule—or moves faster. No delays, no communication gaps, and no friction. Just high-quality, collaborative analysis from a lab that speaks your scientific language.

Collaborative Research
We collaborate on grant applications, including RFPs, EU Horizon projects, and national subsidies—acting as a credible, data-driven partner with both scientific and market expertise.
Collaboration
Academic labs often struggle to find partners who combine scientific credibility with practical, market-ready implementation—something increasingly required in competitive grant applications.
Soilytix bridges the gap between research and real-world application. We bring full biological insight, in-house lab capabilities, and a clear, collaborative mindset to every project. Share your opportunity with us, and we’ll explore whether it’s a fit—scientifically and strategically.
Once selected as a partner, we support proposal development and project design—and can become a long-term research ally for future grant calls.

Precision Variety Placement
We develop a predictive model that matches crop varieties to the biological profile of your soil—combining in-depth microbiome data, historical yield performance, and satellite imagery.
Variety Match Model
For growers, maximizing yield is critical. Yet variety placement is often based on limited physical soil data—or worse, gut feeling—while the biological layer is ignored. This leads to mismatches between crop and soil, and ultimately to reduced yield or quality.
Soilytix works with you to build a tailored prediction model that integrates soil microbiome data, historical yield performance, and NDVI-based satellite monitoring. The result: a data-driven recommendation per field, per variety—delivered with speed and scientific precision.
The model can run in the background of your existing agritech tools or digital platforms. Agronomists gain better decision support, growers get more precise recommendations, and your product placement becomes smarter, more scalable, and more profitable—leading to stronger customer trust over time.
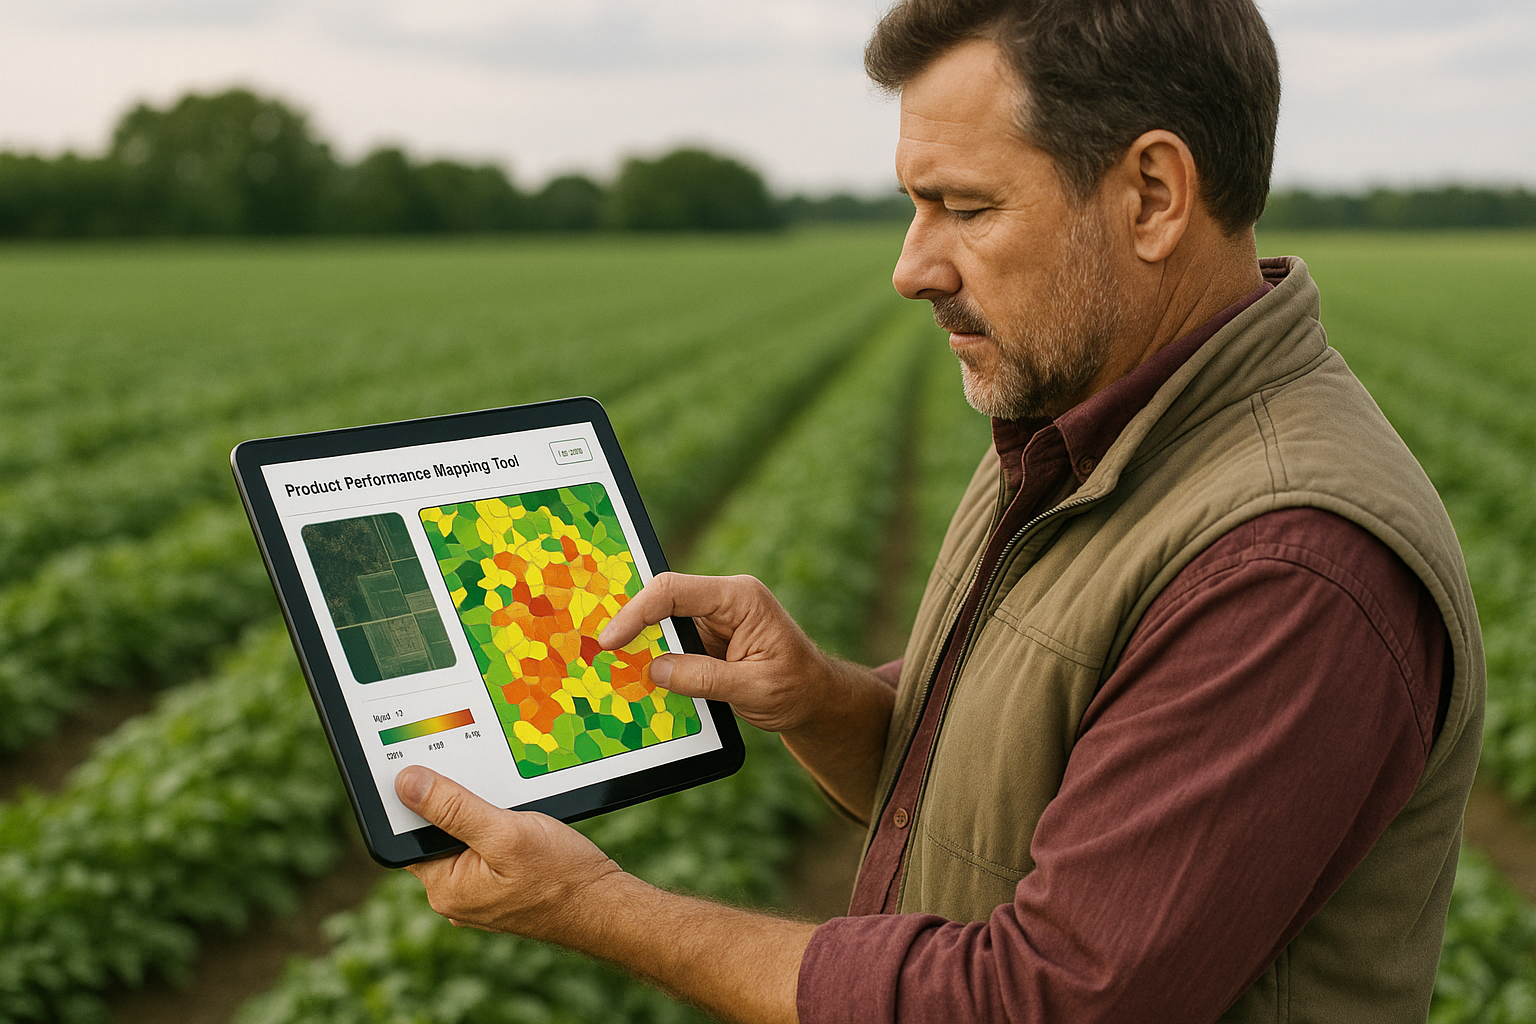
Product Efficiency Mapping
We create a placement model that identifies where your product performs best. Using soil biology, satellite data, and historical performance, we generate location-specific insights your sales team can use in the field.
Product Performance Mapping Tool
Agricultural products like fertilizers or inoculants are often applied uniformly, without accounting for local soil biology. As a result, performance varies, customer confidence drops, and opportunities are missed.
Soilytix integrates microbiome analysis, satellite NDVI data, and product history to create clear spatial maps. These show where your product is most effective and can be used directly by sales reps and agronomists in existing field tools.
Your products are used where they perform best. Growers see stronger results. Sales teams make better recommendations. The result is higher product impact, more satisfied customers, and increased revenue.
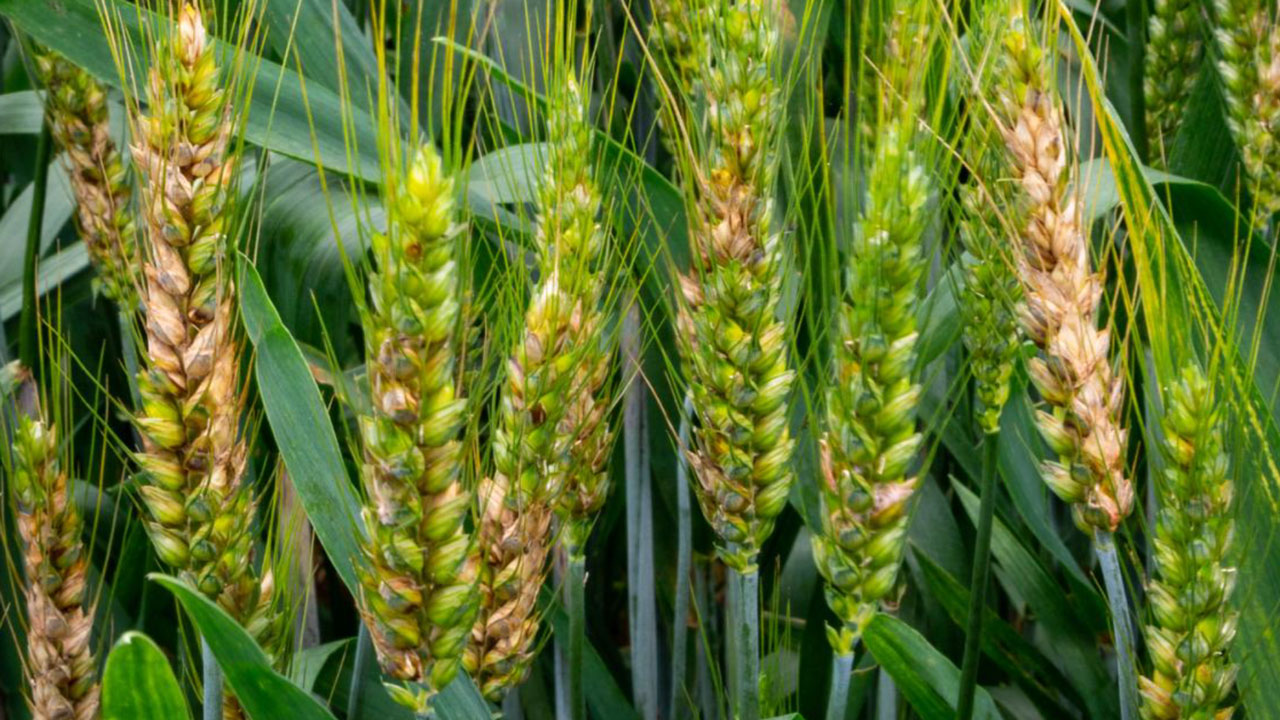
Pathogen Eruption Forecasting
We analyze soil biology alongside physical and chemical properties to identify the drivers behind pathogen outbreaks. By integrating pathogen pressure data with microbiome profiles, we help you understand and predict where and why eruptions occur.
Pathogen Risk Forecast Model
Pathogen outbreaks often occur in specific field zones without clear explanation from texture or chemistry alone. In some areas with the same pathogen load, crops suffer significantly more than in others. This unpredictability leads to unnecessary yield loss.
Soilytix overlays microbiome data with physical soil traits and pathogen pressure readings to uncover what biological taxa or nutrient conditions increase or suppress eruption potential. This helps decode the underlying risk dynamics in each zone of the field.
You receive a predictive map highlighting areas with elevated pathogen eruption risk. The model also identifies key microbial or nutrient factors driving outbreaks, providing direction for targeted interventions and management strategies that protect yield.
Soils are complex ecosystems – three-dimensional and highly heterogeneous
.svg)
.svg)